Multiple Choice
The following graph shows the populations of the metropolitan areas of City X and City Y over six years. 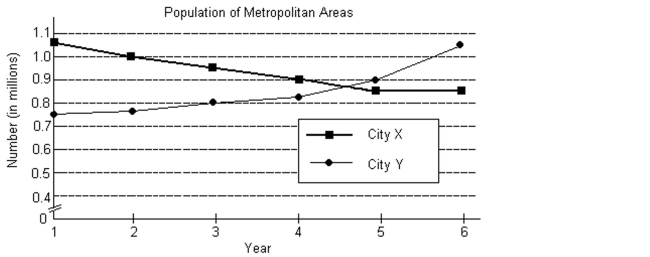
-Express the solution of the system as an ordered pair.
A) approximately (3.1, 0.95)
B) approximately (3.9, 0.92)
C) approximately (4.6, 0.87)
D) approximately (1.2, 1.03)
Correct Answer:

Verified
Correct Answer:
Verified
Related Questions
Q68: Use Cramer's rule to solve the
Q69: Find the partial fraction decomposition for
Q70: Provide an appropriate response.<br>-Describe the elements
Q71: Use the Gauss-Jordan method to solve
Q72: Let <span class="ql-formula" data-value="A =
Q74: Graph the solution set of the
Q75: Solve the system by using the
Q76: A nonlinear system is given, along
Q77: Find the partial fraction decomposition for
Q78: Use Cramer's rule to solve the