Multiple Choice
The following graph shows the populations of the metropolitan areas of City X and City Y over six years. 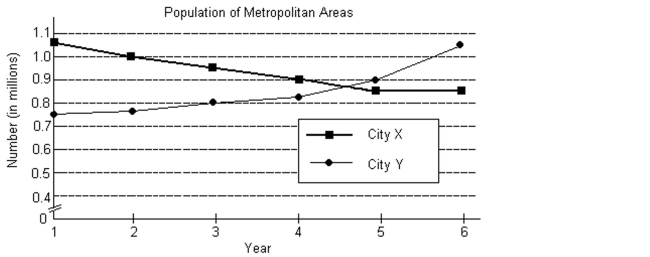
-Use the terms increasing, decreasing, and/or constant to describe the trends for the population of the City X metropolitan area.
A) The population of the City X metropolitan area was increasing from Year 1 to Year 6.
B) The population of the City X metropolitan area was decreasing from Year 1 to Year 5 and was constant from Year 5 to Year 6.
C) The population of the City X metropolitan area was decreasing from Year 1 to Year 6.
D) The population of the City X metropolitan area was increasing from Year 1 to Year 5 and was constant from Year 5 to Year 6.
Correct Answer:

Verified
Correct Answer:
Verified
Q62: The graph shows the region of
Q63: Determine the inequality which matches the
Q64: Choose the one alternative that best
Q65: Choose the one alternative that best
Q66: Solve the system. If the system
Q68: Use Cramer's rule to solve the
Q69: Find the partial fraction decomposition for
Q70: Provide an appropriate response.<br>-Describe the elements
Q71: Use the Gauss-Jordan method to solve
Q72: Let <span class="ql-formula" data-value="A =