Multiple Choice
The graph shows the region of feasible solutions. Find the maximum or minimum value, as specified, of the objective
function.
- 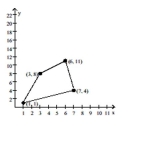
A) 7
B) 39
C) 29
D) 25
Correct Answer:

Verified
Correct Answer:
Verified
Related Questions
Q470: Solve the system for x and
Q471: Solve the problem using matrices.<br>-Ron attends a
Q472: Graph the solution set of the
Q473: Determine the system of inequalities illustrated
Q474: Find the partial fraction decomposition for
Q476: Give all solutions of the nonlinear
Q477: Find the value of the determinant.<br>-
Q478: Solve the equation for x.<br> <span
Q479: Find the cofactor of the indicated
Q480: Solve the system by elimination.<br>6x +