Multiple Choice
The graph shows an idealized linear relationship for the average monthly payment to retirees from 1995 to 1999. Use the midpoint formula to estimate the average payment in 1997.
Average Monthly Payment to Retirees 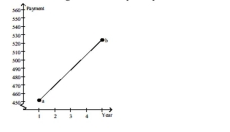
A) $36
B) $524
C) $488
D) $500
Correct Answer:

Verified
Correct Answer:
Verified
Related Questions
Q9: Use the graph to determine the
Q10: The graph of a linear function
Q11: Graph the equation by determining the
Q12: The line graph shows the recorded
Q13: Give the domain and range of
Q15: Find the slope of the line
Q16: Give a rule for the piecewise-defined
Q17: Use a graphing calculator to solve
Q18: Decide whether the relation defines a function.<br>-<img
Q19: Graph the equation by determining the