Multiple Choice
The line graph shows the recorded hourly temperatures in degrees Fahrenheit at an airport. 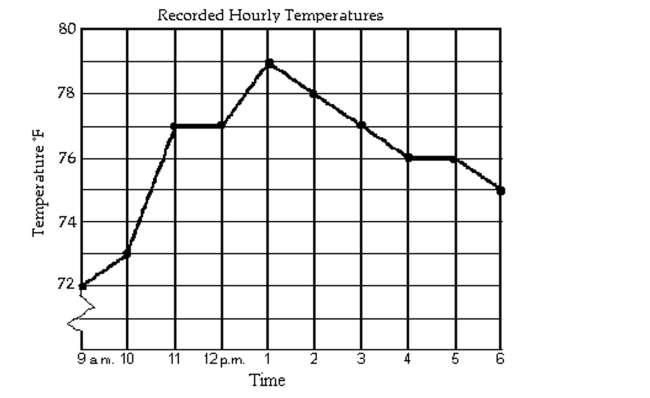
-What temperature was recorded at 5 p.m.?
A)
B)
C)
D)
Correct Answer:

Verified
Correct Answer:
Verified
Related Questions
Q7: Find the requested value.<br>- <span class="ql-formula"
Q8: Determine the largest open intervals of
Q9: Use the graph to determine the
Q10: The graph of a linear function
Q11: Graph the equation by determining the
Q13: Give the domain and range of
Q14: The graph shows an idealized linear
Q15: Find the slope of the line
Q16: Give a rule for the piecewise-defined
Q17: Use a graphing calculator to solve