Multiple Choice
The line graph shows the recorded hourly temperatures in degrees Fahrenheit at an airport. 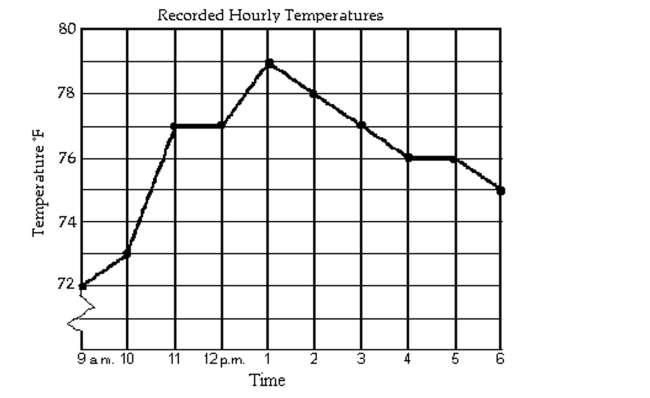
-At what time was the temperature 77°?
A) 12 p.m. and 3 p.m.
B) 11 a.m. and 12 p.m. and 3 p.m.
C) 11 a.m. and 12 p.m.
D) 2 p.m.
Correct Answer:

Verified
Correct Answer:
Verified
Related Questions
Q511: Select the equation that describes the
Q512: Write an equation for the line
Q513: Compute and simplify the difference quotient
Q514: Find the requested value.<br>- <span class="ql-formula"
Q515: Write all linear equations in slope-intercept
Q517: Provide an appropriate response.<br>-What is the
Q518: Describe how the graph of the
Q519: Find the average rate of change illustrated
Q520: Match the description with the correct
Q521: Decide whether the relation defines a