Multiple Choice
Find the average rate of change illustrated in the graph.
-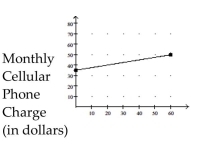 Usage (in minutes)
A) $4.00 per minute
B) $2.00 per minute
C) $0.25 per minute
D) $0.50 per minute
Correct Answer:

Verified
Correct Answer:
Verified
Related Questions
Q514: Find the requested value.<br>- <span class="ql-formula"
Q515: Write all linear equations in slope-intercept
Q516: The line graph shows the recorded hourly
Q517: Provide an appropriate response.<br>-What is the
Q518: Describe how the graph of the
Q520: Match the description with the correct
Q521: Decide whether the relation defines a
Q522: Determine whether <span class="ql-formula" data-value="(
Q523: Select the equation that describes the
Q524: The line graph shows the recorded hourly