Multiple Choice
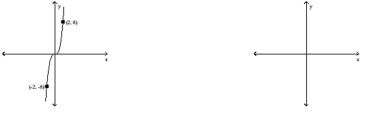
The figure below shows the graph of a functio e this graph to
- 
A) 
B) 
C) 
D) 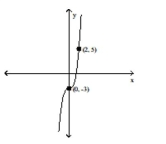
Correct Answer:

Verified
Correct Answer:
Verified
Related Questions
Q384: Determine whether the equation has a
Q385: Graph the line described.<br>- <span class="ql-formula"
Q386: Decide whether the relation defines a function.<br>-<img
Q387: Give the domain and range of
Q388: Graph the line described.<br>- <span class="ql-formula"
Q390: Use the graph to solve the problem.<br>-The
Q391: Find the slope and the y-intercept
Q392: Find all points <span class="ql-formula"
Q393: Describe how the graph of the
Q394: Find the requested value.<br>- <span class="ql-formula"