Related Questions
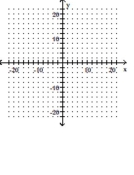
Q389: The figure below shows the graph
Q390: Use the graph to solve the problem.<br>-The
Q391: Find the slope and the y-intercept
Q392: Find all points <span class="ql-formula"
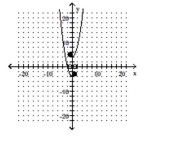
Q393: Describe how the graph of the
Q395: A new chocolate company is estimating how
Q396: Decide whether the relation defines a
Q397: Determine whether the three points are
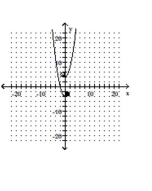
Q398: Describe how the graph of the
Q399: Find the average rate of change