Multiple Choice
A new chocolate company is estimating how many candy bars per week college students will consume of their line of
products. The graph shows the probable number of candy bars students (age 18-22) will consume from year 0 to year 10.
B(x) gives the number of candy bars for boys, G(x) gives the number of candy bars for girls, and T(x) gives the total
number for both groups. Use the graph to answer the question. 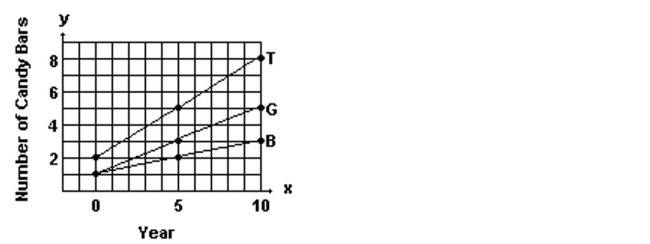
-Estimate B(7) and G(7) and use your estimates to estimate T(7) .
A) 2.5; 4.0; 6.5
B) 2.2; 4.3; 6.5
C) 3.5; 4.2; 7.7
D) 2.3; 4.0; 6.3
Correct Answer:

Verified
Correct Answer:
Verified
Q390: Use the graph to solve the problem.<br>-The
Q391: Find the slope and the y-intercept
Q392: Find all points <span class="ql-formula"
Q393: Describe how the graph of the
Q394: Find the requested value.<br>- <span class="ql-formula"
Q396: Decide whether the relation defines a
Q397: Determine whether the three points are
Q398: Describe how the graph of the
Q399: Find the average rate of change
Q400: Write all linear equations in slope-intercept