Multiple Choice
A new chocolate company is estimating how many candy bars per week college students will consume of their line of
products. The graph shows the probable number of candy bars students (age 18-22) will consume from year 0 to year 10.
B(x) gives the number of candy bars for boys, G(x) gives the number of candy bars for girls, and T(x) gives the total
number for both groups. Use the graph to answer the question. 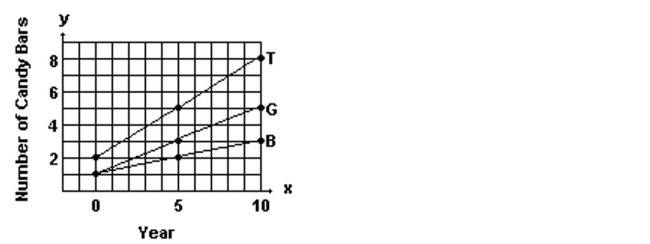
-Use the slopes of the line segments to decide in which period ( or the number of candy bars per week increased more rapidly.
A) 0-5
B)
C) The number of candy bars increased at the same rate in both periods
Correct Answer:

Verified
Correct Answer:
Verified
Q169: Use the graphs to find the
Q170: Find the slope and the y-intercept
Q171: Give a rule for the piecewise-defined
Q172: Consider the function h as defined.
Q173: Find the coordinates of the other
Q175: Graph the circle.<br>- <span class="ql-formula" data-value="x^{2}+(y-5)^{2}=9"><span
Q176: Graph the point symmetric to the given
Q177: Find the specified domain.<br>-Find the domain
Q178: Describe the transformations and give the
Q179: Give the domain and range of