Essay
One thousand students from a local university were sampled to gather information such as gender, high school GPA, college GPA, and total SAT scores. The results were used to create histograms displaying high school grade point averages (GPA’s) for both males and females. Compare the grade distribution of males and females.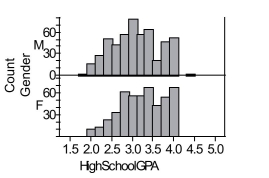
Correct Answer:

Verified
The distributions of high school GPA for...View Answer
Unlock this answer now
Get Access to more Verified Answers free of charge
Correct Answer:
Verified
View Answer
Unlock this answer now
Get Access to more Verified Answers free of charge
Q8: The boxplots show prices of used cars
Q9: The boxplots show prices of used cars
Q10: The five-number summary for midterm scores
Q11: The side-by-side boxplots show the cumulative college
Q12: The side-by-side boxplots show the cumulative college
Q14: At www.census.gov you can create a "population
Q15: How do sports salaries compare? Two sets
Q16: One thousand students from a local university
Q17: On the right are two dotplots made
Q18: The side-by-side boxplots show the cumulative college