Multiple Choice
One thousand students from a local university were sampled to gather information such as
Gender, high school GPA, college GPA, and total SAT scores.The results were used to create Histograms displaying high school grade point averages (GPAs) for both males and females. Compare the grade distribution of males and females.Check all that apply. 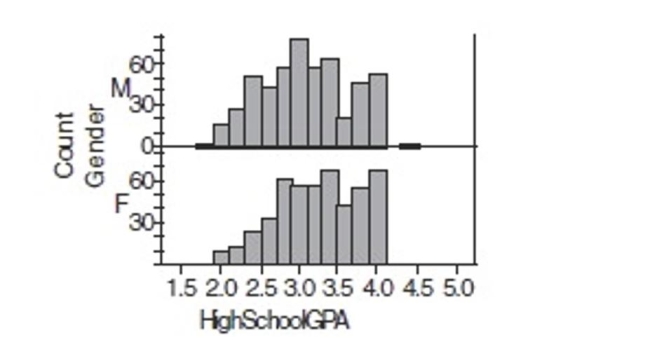
A) Both distributions are skewed to the left.
B) Both distributions appear to be centered at a GPA of about 3.0.
C) The distributions are skewed in different directions.
D) The distributions are differ strongly in center.
E) The distribution of male GPA appears slightly more spread out than the distribution of female GPA
Correct Answer:

Verified
Correct Answer:
Verified
Q11: The side-by-side boxplots show the cumulative college
Q12: The side-by-side boxplots show the cumulative college
Q13: One thousand students from a local university
Q14: At www.census.gov you can create a "population
Q15: How do sports salaries compare? Two sets
Q17: On the right are two dotplots made
Q18: The side-by-side boxplots show the cumulative college
Q19: At www.census.gov you can create a "population
Q20: The side-by-side boxplots show the cumulative college
Q21: A few of the male students are