Multiple Choice
Use this graph to answer the question.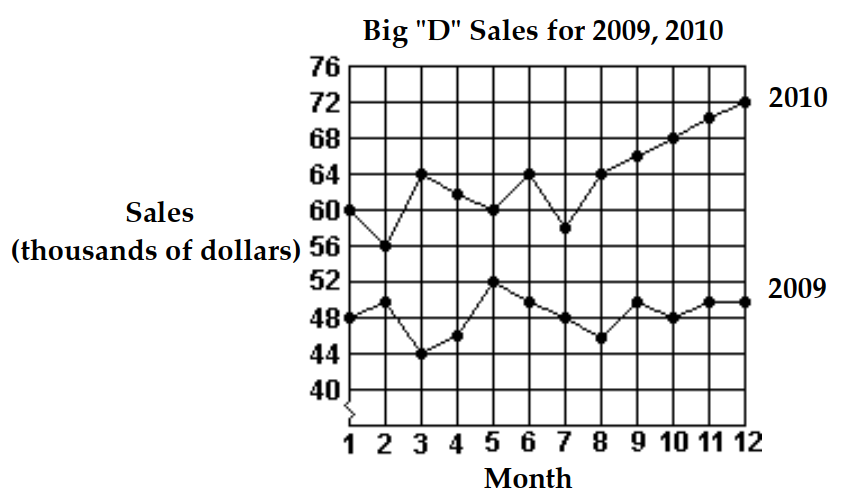
-What was the total increase in sales for the first 6 months from 2009 to 2010?
A) $652,000
B) $18,000
C) $12,000
D) $76,000
Correct Answer:

Verified
Correct Answer:
Verified
Related Questions
Q89: Complete the ordered pairs. Then graph
Q90: Identify whether the slope is positive, negative,
Q91: Find the average rate of change.
Q92: Choose one of the four lines
Q93: Decide whether the statement is true or
Q95: Complete the ordered pairs. Then graph
Q96: Write the equation of a circle
Q97: Choose the equation that matches the
Q98: Give the quadrant in which the point
Q99: <span class="ql-formula" data-value="\text { The graphs of