Multiple Choice
Use the graph of population change per year for a metro area to answer the question. 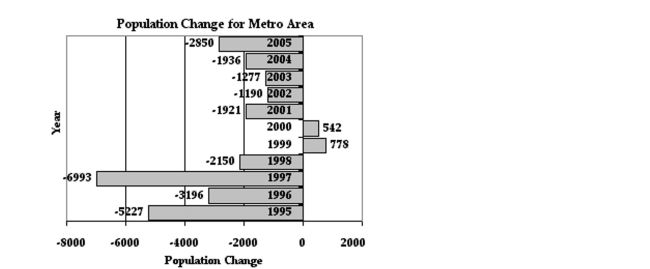
-What is the difference of the 2001 and 2000 population changes?
A) -2463
B) 2928
C) -2928
D) 2463
Correct Answer:

Verified
Correct Answer:
Verified
Related Questions
Q387: Simplify the complex fraction.<br>- <span class="ql-formula"
Q388: In a school survey, students showed these
Q389: Use the graph to answer the question.
Q390: Solve the problem.<br>-If John puts
Q391: Find the root. Round to three
Q393: Write a fraction in lowest terms
Q394: Simplify and evaluate using a calculator.<br>-
Q395: Solve the problem.<br>-The normal monthly precipitation
Q396: Solve the problem.<br>-Last year, Maria earned $310
Q397: Every whole number is a real number.