Multiple Choice
Use the graph to answer the question. 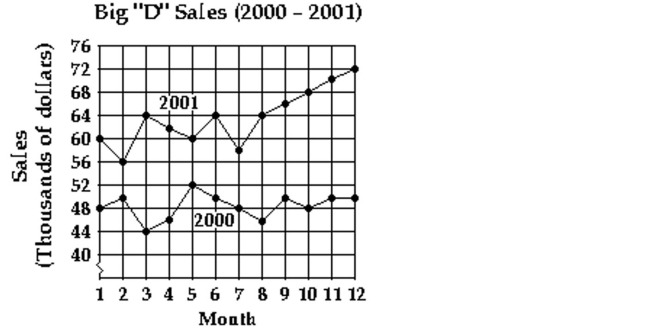
-Use a signed number to represent the change in sales from 2000 to 2001?
A) $22,000
B) $1,342,000
C) $182,000
D) $12,000
Correct Answer:

Verified
Correct Answer:
Verified
Related Questions
Q384: Solve the problem.<br>-In a manufacturing operation,
Q385: Solve the problem.<br>-The appliance store where the
Q386: Perform the indicated operation.<br>-8 - (-2)<br>A)6<br>B)-6<br>C)10<br>D)-10
Q387: Simplify the complex fraction.<br>- <span class="ql-formula"
Q388: In a school survey, students showed these
Q390: Solve the problem.<br>-If John puts
Q391: Find the root. Round to three
Q392: Use the graph of population change per
Q393: Write a fraction in lowest terms
Q394: Simplify and evaluate using a calculator.<br>-