Multiple Choice
A medical research team studied the ages of patients who had strokes caused by stress. The ages of 34 patients who suffered stress strokes were as follows.
Construct a frequency and relative frequency distribution for these ages. Use 8 classes beginning with a lower class limit of 25 .
A) 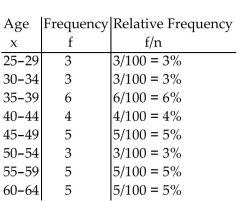
B) 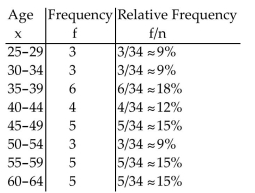
C) 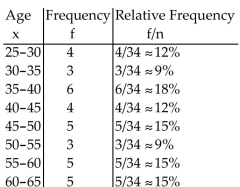
D) 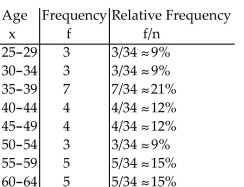
Correct Answer:

Verified
Correct Answer:
Verified
Q66: Explain the difference between a frequency distribution
Q67: Provide an appropriate response.<br>-The two most frequently
Q68: Construct a stem and leaf display
Q69: Find the mean for the given sample
Q70: Make a bar graph to represent
Q72: Find the median.<br>- <span class="ql-formula" data-value="\begin{array}
Q73: Find the median.<br>- <span class="ql-formula" data-value="\begin{array}
Q74: This double-bar graph shows the number of
Q75: In a school survey, students showed these
Q76: useful for comparing the size of each