Multiple Choice
This double-bar graph shows the number of male (M) and female (F) athletes at a university over a four-year period.
Answer the question. 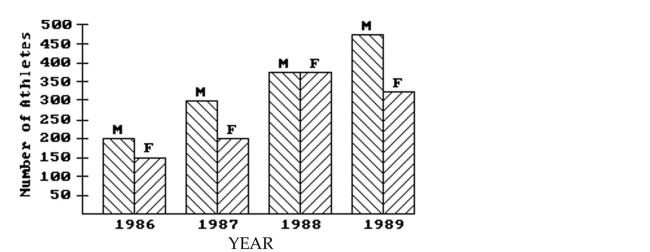
-Which year had the same number of male and female athletes?
A) 1988
B) 1986
C) 1987
D) 1989
Correct Answer:

Verified
Correct Answer:
Verified
Related Questions
Q69: Find the mean for the given sample
Q70: Make a bar graph to represent
Q71: A medical research team studied the
Q72: Find the median.<br>- <span class="ql-formula" data-value="\begin{array}
Q73: Find the median.<br>- <span class="ql-formula" data-value="\begin{array}
Q75: In a school survey, students showed these
Q76: useful for comparing the size of each
Q77: Answer the question.<br>-The bar graph below shows
Q78: In a school survey, students showed these
Q79: useful for comparing the size of each