Multiple Choice
Use this graph to answer the question. 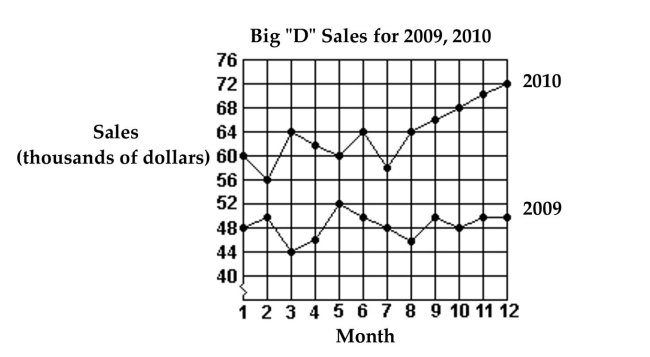
-What month in 2009 had the highest sales?
A) Month 3
B) Month 5
C) Month 2
D) Month 12
Correct Answer:

Verified
Correct Answer:
Verified
Related Questions
Q43: Use this graph to answer the question.<br><img
Q113: Find the mode or modes.<br>-5, 9, 42,
Q114: Solve the problem.<br>-Bengisu was pregnant 270 days
Q115: Find the median for the given
Q116: Find the median for the given
Q118: Use the graph to answer the question.<br>-<img
Q119: Explain in your own words the difference
Q120: Use the graph to answer the question.<br>-<img
Q121: Find the mean for the given sample
Q122: Use the information to complete a