Multiple Choice
Use the graph to answer the question.
-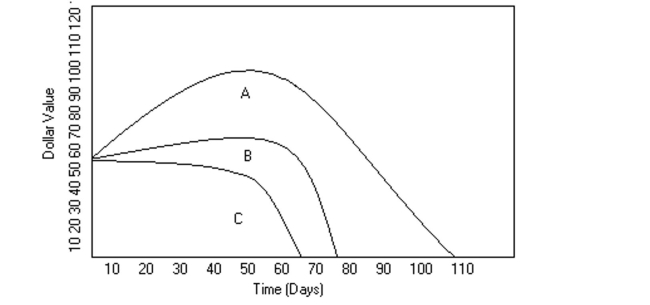 Mike decides to buy shares of companies A, B, and C, which were initially selling for the same price. The changes in each stock's value are shown in the graph above. After how many days did
Stock C's value go below $20?
A) 30
B) 40
C) 60
D) 80
Correct Answer:

Verified
Correct Answer:
Verified
Related Questions
Q115: Find the median for the given
Q116: Find the median for the given
Q117: Use this graph to answer the question.
Q118: Use the graph to answer the question.<br>-<img
Q119: Explain in your own words the difference
Q121: Find the mean for the given sample
Q122: Use the information to complete a
Q123: Find the mode or modes.<br>-7.35, 7.41, 7.56,
Q124: This double-bar graph shows the number of
Q125: Find the median.<br>-6, 2, 26, 14, 49,