Multiple Choice
Answer the question.
-The bar graph below shows the number of students by major in the College of Arts and Sciences. 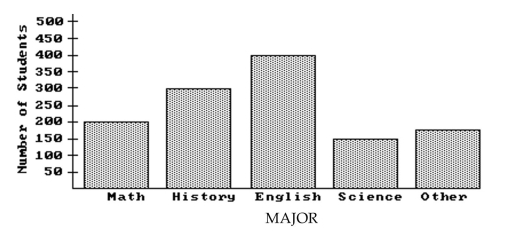
How many students are majoring in Math?
A) 300
B) 200
C) 250
D) 150
Correct Answer:

Verified
Correct Answer:
Verified
Related Questions
Q16: Construct a frequency polygon.<br>- <span class="ql-formula"
Q17: Construct the specified histogram.<br>-The frequency table
Q18: Find the mean for the given
Q19: Provide an appropriate response.<br>-The median of a
Q20: Use the information to complete a
Q22: This double-bar graph shows the number of
Q23: Find the mean for the given
Q24: This double-bar graph shows the number of
Q25: Find the indicated probability.<br>-The age distribution
Q26: Find the median for the given sample