Multiple Choice
This double-bar graph shows the number of male (M) and female (F) athletes at a university over a four-year period.
Answer the question. 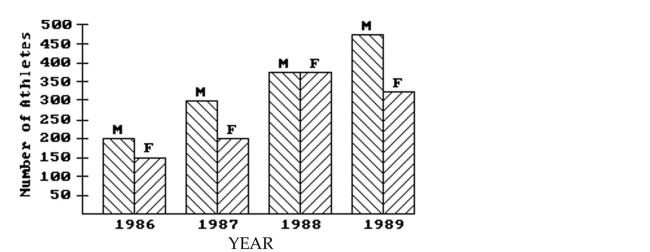
-Which year had the smallest number of male athletes?
A) 1989
B) 1986
C) 1988
D) 1987
Correct Answer:

Verified
Correct Answer:
Verified
Related Questions
Q19: Provide an appropriate response.<br>-The median of a
Q20: Use the information to complete a
Q21: Answer the question.<br>-The bar graph below shows
Q22: This double-bar graph shows the number of
Q23: Find the mean for the given
Q25: Find the indicated probability.<br>-The age distribution
Q26: Find the median for the given sample
Q27: In a school survey, students showed these
Q28: Find the mean for the given sample
Q29: Solve the problem.<br>-Horace's mean score on five