Multiple Choice
This double-bar graph shows the number of male (M) and female (F) athletes at a university over a four-year period.
Answer the question. 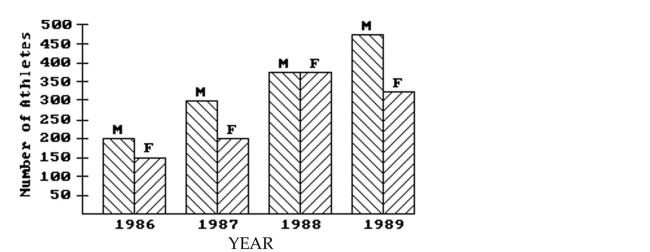
-Which year had the greatest number of female athletes?
A) 1987
B) 1988
C) 1986
D) 1989
Correct Answer:

Verified
Correct Answer:
Verified
Related Questions
Q43: Use this graph to answer the question.<br><img
Q104: This double-bar graph shows the number of
Q105: Find the mean for the given
Q106: Find the indicated probability.<br>-A relative frequency
Q107: Find the mean for the given
Q108: Shortly before an election, a market
Q110: Find the indicated probability.<br>-A relative frequency
Q111: This double-bar graph shows the number of
Q113: Find the mode or modes.<br>-5, 9, 42,
Q114: Solve the problem.<br>-Bengisu was pregnant 270 days