Multiple Choice
This double-bar graph shows the number of male (M) and female (F) athletes at a university over a four-year period.
Answer the question. 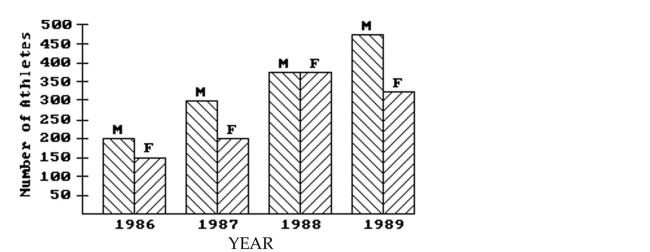
-Has the total number of students involved in athletics increased each year?
A) Yes.
B) No.
Correct Answer:

Verified
Correct Answer:
Verified
Related Questions
Q99: Find the median for the given sample
Q100: This double-bar graph shows the number of
Q101: Find the mean for the given
Q102: Find the median for the given
Q103: In a school survey, students showed these
Q105: Find the mean for the given
Q106: Find the indicated probability.<br>-A relative frequency
Q107: Find the mean for the given
Q108: Shortly before an election, a market
Q109: This double-bar graph shows the number of