Multiple Choice
This double-bar graph shows the number of male (M) and female (F) athletes at a university over a four-year period.
Answer the question. 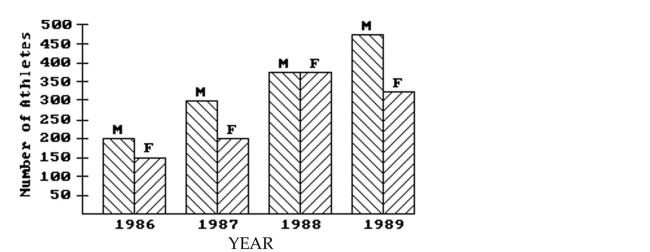
-What is the only year in which the number of female athletes declined from its previous value?
A) 1986
B) 1987
C) 1989
D) 1988
Correct Answer:

Verified
Correct Answer:
Verified
Related Questions
Q119: Explain in your own words the difference
Q120: Use the graph to answer the question.<br>-<img
Q121: Find the mean for the given sample
Q122: Use the information to complete a
Q123: Find the mode or modes.<br>-7.35, 7.41, 7.56,
Q125: Find the median.<br>-6, 2, 26, 14, 49,
Q126: Shortly before a mayoral election, a
Q127: Construct a stem and leaf display
Q128: Construct a stem and leaf display
Q129: Construct a frequency polygon.<br>- <span class="ql-formula"