Multiple Choice
Use this graph to answer the question. 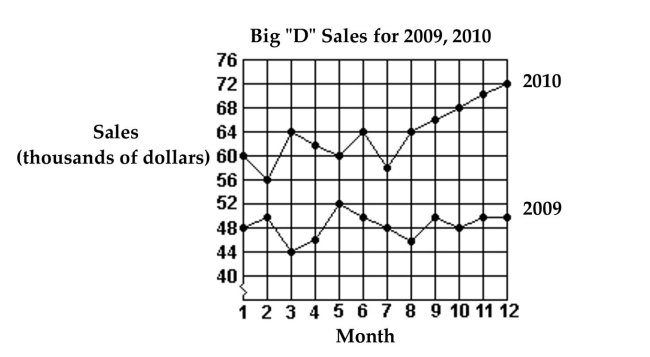
-What were the total sales for the first 6 months of 2009?
A) $240,000
B) $366,000
C) $290,000
D) $46,000
Correct Answer:

Verified
Correct Answer:
Verified
Related Questions
Q47: Find the mean for the given
Q48: Find the median for the given
Q49: Find the mode or modes.<br>-Last year,
Q50: Use the graph to answer the question.<br>-<img
Q51: Construct a frequency polygon.<br>- <span class="ql-formula"
Q53: Find the mean for the given sample
Q54: Construct the specified histogram.<br>-The ages of
Q55: Find the median.<br>-41, 14, 7, 7, 28,
Q56: Find the mean for the given
Q57: In a school survey, students showed these