Multiple Choice
Solve the problem. Round your answers to the nearest whole percent.
-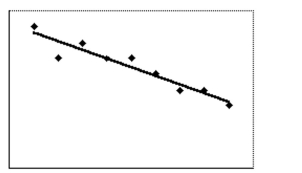 The scatter diagram shows the data for price per item (y) and the availability of that item (x) . The correlation coefficient r
Is -0.95. Determine how much of the variation in price per item can be accounted for by the best-fit line.
A) 5%
B) 10%
C) 95%
D) 90%
Correct Answer:

Verified
Correct Answer:
Verified
Q30: Determine whether the stated causal connection is
Q31: Including the outlier, estimate or compute the
Q32: State whether you believe the two variables
Q33: Solve the problem.<br>-A reporter studied the causes
Q34: State whether you believe the two variables
Q36: Select the best estimate of the correlation
Q37: The table contains the weights (in
Q38: Answer the question using the value of
Q39: Construct a scatter diagram with several groups
Q40: Determine whether the stated causal connection is