Multiple Choice
Answer the question using the value of r and the given best-fit line on the scatter diagram.
-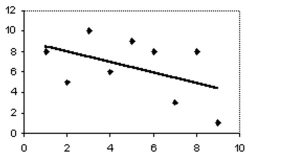 The scatter diagram and best-fit line show the data for the number of cars waiting by a school (y) and the amount of time after the end of classes (x) . The correlation coefficient r is -0.55. Predict the number of cars at time 8
After the end of classes.
A) 6
B) No valid prediction is possible.
C) 5
D) 7
Correct Answer:

Verified
Correct Answer:
Verified
Q33: Solve the problem.<br>-A reporter studied the causes
Q34: State whether you believe the two variables
Q35: Solve the problem. Round your answers to
Q36: Select the best estimate of the correlation
Q37: The table contains the weights (in
Q39: Construct a scatter diagram with several groups
Q40: Determine whether the stated causal connection is
Q41: To get the best deal on
Q42: Answer the question using the value of
Q43: Select the best estimate of the correlation