Multiple Choice
Solve the problem. Round your answers to the nearest whole percent.
-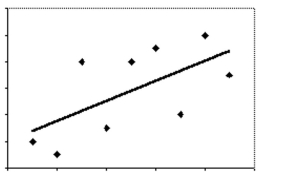 The scatter diagram shows the data for attendance at the local team's hockey games (y) and the number of wins (x) for
That team. The correlation coefficient r is 0.4. Determine how much of the variation in attendance can be accounted for
By the best-fit line.
A) 16%
B) 36%
C) 84%
D) 25%
Correct Answer:

Verified
Correct Answer:
Verified
Q45: Solve the problem. Round your answers
Q46: State whether you believe the two variables
Q47: Write possible coordinates for both outliers so
Q48: State whether you believe the two variables
Q49: How does the outlier affect the correlation
Q50: Construct a scatter diagram with two groups
Q51: Write the coordinates of a point that
Q53: Determine whether the stated causal connection is
Q54: Determine whether the stated causal connection is
Q55: State whether there is no correlation, a