Multiple Choice
Solve the problem. Round your answers to the nearest whole percent.
-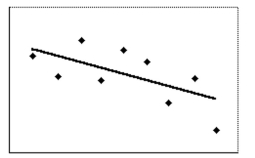
The scatter diagram shows the data for the number of cars waiting by a school (y) and the amount of time after tl of classes (x) . The correlation coefficient is . Determine how much of the variation in the number of wait cars can be accounted for by the best-fit line.
A)
B)
C)
D) end
Correct Answer:

Verified
Correct Answer:
Verified
Q40: Determine whether the stated causal connection is
Q41: To get the best deal on
Q42: Answer the question using the value of
Q43: Select the best estimate of the correlation
Q44: Solve the problem.<br>-The table below shows
Q46: State whether you believe the two variables
Q47: Write possible coordinates for both outliers so
Q48: State whether you believe the two variables
Q49: How does the outlier affect the correlation
Q50: Construct a scatter diagram with two groups