Multiple Choice
Provide the appropriate response.
-The following dot plot represents the ages of the customers who visited a sporting goods store on a particular
Monday. 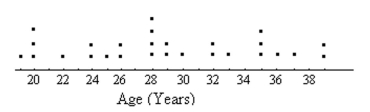
How many people in the sample were aged between 20 and 28, inclusive?
A) 13
B) 10
C) 9
D) 6
Correct Answer:

Verified
Correct Answer:
Verified
Related Questions
Q45: A nurse measured the blood pressure of
Q46: Construct a frequency table for the
Q47: Construct a pie chart representing the
Q48: Answer the question using the graphical display.
Q49: A nurse measured the blood pressure of
Q51: A car insurance company conducted a
Q53: Answer the question using the graphical display.
Q54: Construct the requested table. Round relative
Q55: A nurse measured the blood pressure of
Q66: Explain the difference between a frequency distribution