Multiple Choice
Answer the question using the graphical display. 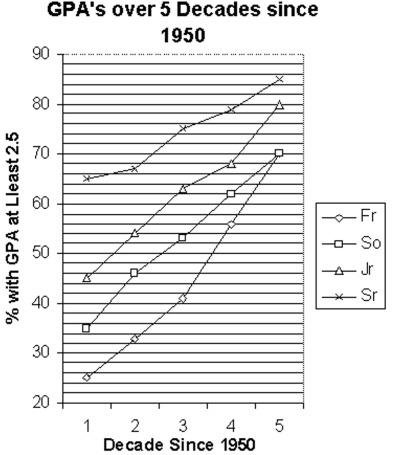
-Determine the percentage increase in sophomore 2.5 or better GPA's over the five decades.
A) 40%
B) 50%
C) 34%
D) 30%
Correct Answer:

Verified
Correct Answer:
Verified
Related Questions
Q22: A newly formed political party has taken
Q23: The stem-and-leaf diagram below shows the
Q24: A newly formed political party has taken
Q25: Provide an appropriate response.<br>-Shortly before a
Q26: Make a bar graph to represent
Q28: Construct an unbinned frequency table for
Q29: Construct the requested histogram.<br>-The data below is
Q30: The stacked line chart shows the value
Q31: Create a graphical display for the
Q119: Explain in your own words the difference