Essay
A newly formed political party has taken a poll in each state to determine voter support. Use the results summarized in the graphic to answer the question. 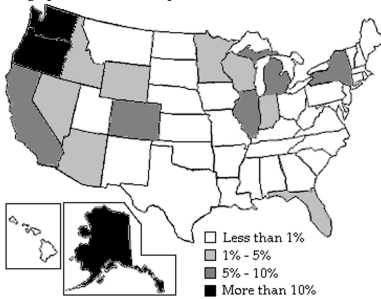
-Discuss possible explanations for the trends that are shown in the graphic.
Correct Answer:

Verified
Answers may vary. Possible exp...View Answer
Unlock this answer now
Get Access to more Verified Answers free of charge
Correct Answer:
Verified
View Answer
Unlock this answer now
Get Access to more Verified Answers free of charge
Q19: Construct a pie chart representing the
Q20: The stacked line chart shows the value
Q21: Construct a pie chart representing the
Q22: A newly formed political party has taken
Q23: The stem-and-leaf diagram below shows the
Q25: Provide an appropriate response.<br>-Shortly before a
Q26: Make a bar graph to represent
Q27: Answer the question using the graphical display.
Q28: Construct an unbinned frequency table for
Q29: Construct the requested histogram.<br>-The data below is