Multiple Choice
Use the graph to answer the question.
-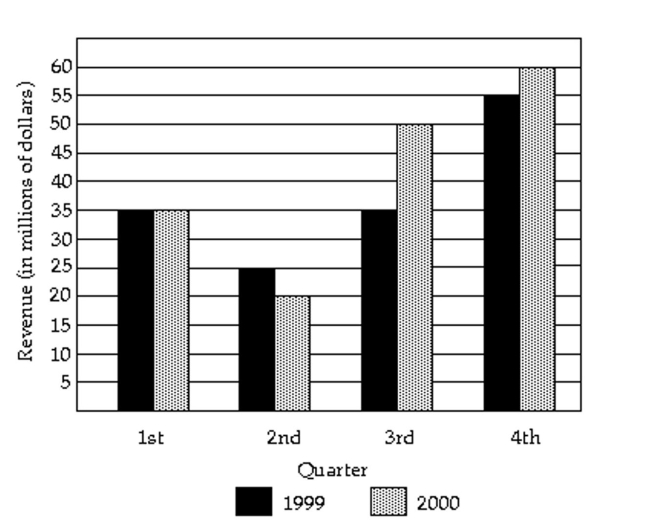
In what quarter was the revenue the greatest for 1999?
A) fourth quarter
B) third quarter
C) first quarter
D) second quarter
Correct Answer:

Verified
Correct Answer:
Verified
Related Questions
Q58: Construct the requested histogram.<br>-The number of
Q59: Provide an appropriate response.<br>-The frequency table
Q60: A machine is supposed to fill
Q61: Answer the question using the graphical display.
Q62: Solve the problem.<br>-Use the high closing
Q64: Solve the problem.<br>-The following data show
Q66: Solve the problem.<br>-Use the high closing
Q67: A nurse measured the blood pressure of
Q68: The bar graph below shows the average
Q182: Provide an appropriate response.<br>-Construct a frequency table