Essay
The bar graph below shows the average cost of renting a studio in a certain city in each of the years 2002 through 2006. 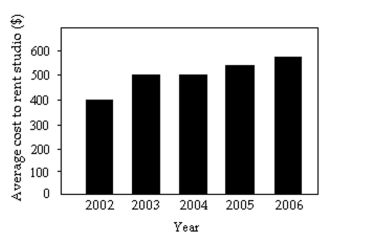
By what percentage does the average rental price increase from 2002 to 2003? Obtain a truncated version of the graph by sliding a piece of paper over the bottom portion of the graph so that the scale on the vertical axis starts at 300. In the truncated graph, by what percentage does the price appear to increase from 2002 to 2003? Why is the truncated graph misleading?
Correct Answer:

Verified
The average price increases by 25% from ...View Answer
Unlock this answer now
Get Access to more Verified Answers free of charge
Correct Answer:
Verified
View Answer
Unlock this answer now
Get Access to more Verified Answers free of charge
Q63: Use the graph to answer the question.<br>-<img
Q64: Solve the problem.<br>-The following data show
Q66: Solve the problem.<br>-Use the high closing
Q67: A nurse measured the blood pressure of
Q69: Use the graph to answer the question.<br>-<img
Q70: Construct a line chart for the
Q71: Provide an appropriate response.<br>-Suppose that a
Q72: A television manufacturer sold three times as
Q73: The following data represent the total
Q182: Provide an appropriate response.<br>-Construct a frequency table