Multiple Choice
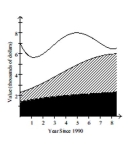
The stacked line chart shows the value of each of Danny's investments. The stacked line chart contains three regions. The uppermost unshaded region represents the value of Danny's investment in individual stocks. The center shaded region represents the value of Danny's investment in mutual funds and the bottom region in black represents the value of Danny's investment in a CD. The thickness of a region at a particular time tells you its value at that time.  Use the graph to answer the question.
-In the year 1998, what was the approximate value of Danny's investment in mutual funds?
A) $6000
B) $4000
C) $2500
D) $1900
Correct Answer:

Verified
Correct Answer:
Verified
Q15: Construct a line chart for the
Q16: Construct a pie chart representing the
Q17: Provide an appropriate response.<br>-A professional tennis
Q18: Construct the requested table. Round relative
Q19: Construct a pie chart representing the
Q21: Construct a pie chart representing the
Q22: A newly formed political party has taken
Q23: The stem-and-leaf diagram below shows the
Q24: A newly formed political party has taken
Q25: Provide an appropriate response.<br>-Shortly before a