Multiple Choice
The graph below shows the approximate annual percentage growth rate in world population for the years 1960 through
2010. Data is estimated by the UN Census Bureau.
Annual Growth Rate (Percentage) 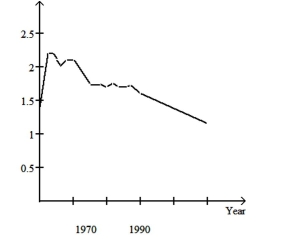 Use the graph to answer the question.
-Describe the trend in world population during the period 1976-1978
A) It increases at a faster and faster rate
B) It decreases at a steady rate
C) It remains constant
D) It increases at a steady rate
Correct Answer:

Verified
Correct Answer:
Verified
Q22: Use the guidelines to evaluate the study.
Q23: Answer the question.<br>-The graph below shows the
Q24: In order to answer the given question,
Q25: Use the guidelines to evaluate the study.
Q26: Answer the question.<br>-What name is given to
Q28: Make a bar graph to represent
Q29: Choose the best wording for the question
Q30: Determine whether the study involves selection bias,
Q31: Construct a line chart for the
Q32: Construct a pie chart representing the