Multiple Choice
The graph below shows estimated world population for the period . Note that the logarithm of the world population and not actual population is plotted on the vertical axis. This means, for example, that when the graph reaches 7 on the vertical scale, world population is and when the graph reaches 9 on the vertical scale, world population is . 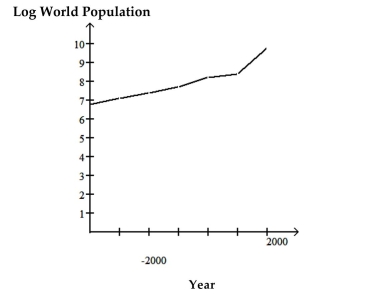 Use the graph to answer the question.
-During the period 4000 BC to 1000 BC, approximately what was the doubling time for world population?
A) Approximately 23,000 years
B) Approximately 1000 years
C) Approximately 3000 years
D) Approximately 5000 years
Correct Answer:

Verified
Correct Answer:
Verified
Q16: In order to answer the given question,
Q17: Answer the question.<br>-Which of the following quantities
Q18: Describe how you would apply the five
Q19: Identify which of these types of sampling
Q20: Solve the problem.<br>-For the study described below,
Q22: Use the guidelines to evaluate the study.
Q23: Answer the question.<br>-The graph below shows the
Q24: In order to answer the given question,
Q25: Use the guidelines to evaluate the study.
Q26: Answer the question.<br>-What name is given to