Multiple Choice
The graph below shows the approximate annual percentage growth rate in world population for the years 1960 through
2010. Data is estimated by the UN Census Bureau. 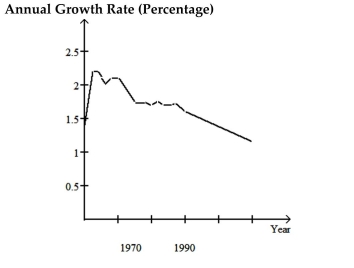 Use the graph to answer the question.
-Describe the trend in world population during the period 1960-1962
A) It increases at a constant rate
B) It decreases at a steady rate
C) It increases at a faster and faster rate
D) It remains constant
Correct Answer:

Verified
Correct Answer:
Verified
Q32: Construct a pie chart representing the
Q33: Use the graph to answer the
Q34: Identify the variable as either qualitative or
Q35: Make a bar graph to represent
Q36: Answer the question.<br>-In a study to determine
Q38: Identify the variable as either qualitative or
Q39: Answer the question.<br>-Which of the following describes
Q40: Provide an appropriate response.<br>-Suppose that you
Q41: Create a graphical display for the
Q42: Use the guidelines to evaluate the study.