Multiple Choice
Use the graph to answer the question.
-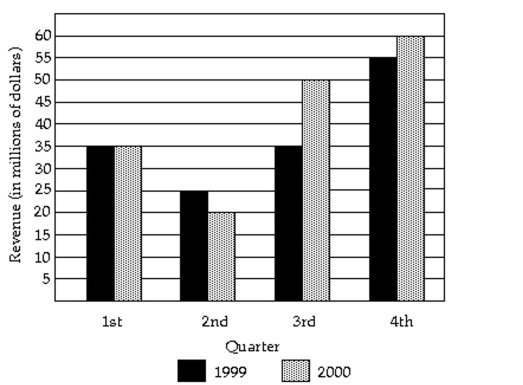
What was the revenue for the first quarter of 2000 ?
A) million
B) million
C) million
D) million
Correct Answer:

Verified
Correct Answer:
Verified
Related Questions
Q28: Make a bar graph to represent
Q29: Choose the best wording for the question
Q30: Determine whether the study involves selection bias,
Q31: Construct a line chart for the
Q32: Construct a pie chart representing the
Q34: Identify the variable as either qualitative or
Q35: Make a bar graph to represent
Q36: Answer the question.<br>-In a study to determine
Q37: The graph below shows the approximate annual
Q38: Identify the variable as either qualitative or