Essay
Use the graph to answer the question.
-The following time-series diagram tracks the performance of two stocks during the month
of October. 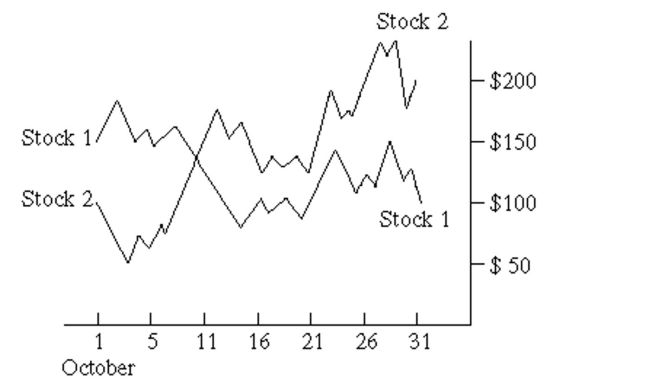 Describe the overall trend in the value of each stock during the month of October. By what
percentage did the value of each stock increase or decrease during the month of October?
Correct Answer:

Verified
The value of stock 1 fluctuated during d...View Answer
Unlock this answer now
Get Access to more Verified Answers free of charge
Correct Answer:
Verified
View Answer
Unlock this answer now
Get Access to more Verified Answers free of charge
Q220: Use the graph to answer the question.<br>-<img
Q221: Answer the question.<br>-What name is given to
Q222: In order to answer the given question,
Q223: Determine whether the study involves selection bias,
Q224: Use the graph to answer the question.<br>-This
Q225: Solve the problem.<br>-For the study described below,
Q226: A sample statistic and margin of
Q228: In order to answer the given question,
Q229: Construct a line chart for the
Q230: Identify the variable as either qualitative or