Multiple Choice
Construct a line chart for the data.
-A medical researcher recorded the ages of patients who had strokes caused by stress. The ages of 34 patients are summarized in the table below:
A) 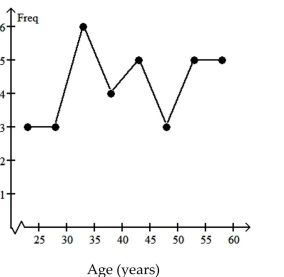
B) 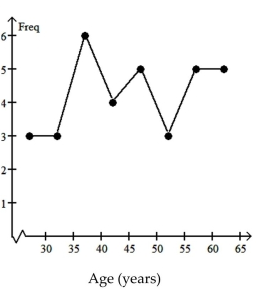
C) 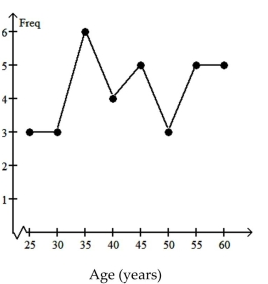
D) None of the above
Correct Answer:

Verified
Correct Answer:
Verified
Related Questions
Q220: Use the graph to answer the question.<br>-<img
Q221: Answer the question.<br>-What name is given to
Q222: In order to answer the given question,
Q223: Determine whether the study involves selection bias,
Q224: Use the graph to answer the question.<br>-This
Q225: Solve the problem.<br>-For the study described below,
Q226: A sample statistic and margin of
Q227: Use the graph to answer the question.<br>-The
Q228: In order to answer the given question,
Q230: Identify the variable as either qualitative or