Multiple Choice
Use the graph to answer the question.
-This double-bar graph shows the number of male (M) and female (F) athletes at a university over a four-year period. 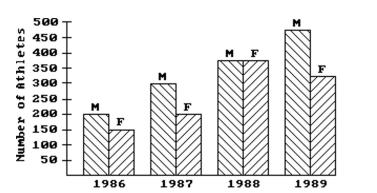 Compare the trend in the number of male athletes during the four-year period and the trend in the
Number of female athletes during the four-year period .
A) The number of male athletes and the number of female athletes increased steadily over the four-year period.
B) The number of male athletes increased steadily over the four-year period. The number of female athletes increased in 1987 then decreased again in 1988 and 1989.
C) The number of male athletes increased steadily over the four-year period. The number of female athletes increased to a peak in 1988 and then decreased again in 1989.
D) The number of female athletes increased steadily over the four-year period. The number of male athletes increased to a peak in 1988 and then decreased again in 1989.
Correct Answer:

Verified
Correct Answer:
Verified
Q195: The stack plot below shows the value
Q196: State whether you think that the variables
Q197: Answer the question.<br>-What name is given to
Q198: The stack plot below shows the value
Q199: Use the guidelines to evaluate the study.
Q201: Answer the question.<br>-Which of the following describes
Q202: Determine whether the study involves selection bias,
Q203: Provide an appropriate response.<br>-Suppose that you
Q204: Choose the best wording for the question
Q205: State whether you think that the variables