Multiple Choice
The stack plot below shows the value of each of Danny's investments. The stack plot contains three regions. Theuppermost unshaded region represents the value of Danny's investment in individual stocks. The center shaded regionrepresents the value of Danny's investment in mutual funds and the bottom region in black represents the value ofDanny's investment in a CD. The thickness of a region at a particular time tells you its value at that time. 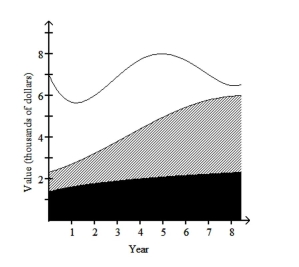 Use the graph to answer the question.
-In year 8, what was the approximate value of Danny's investment in mutual funds?
A) $6000
B) $2500
C) $1900
D) $4000
Correct Answer:

Verified
Correct Answer:
Verified
Q193: Use the indicated bin size to
Q194: State whether the scatter diagram shows strong
Q195: The stack plot below shows the value
Q196: State whether you think that the variables
Q197: Answer the question.<br>-What name is given to
Q199: Use the guidelines to evaluate the study.
Q200: Use the graph to answer the question.<br>-This
Q201: Answer the question.<br>-Which of the following describes
Q202: Determine whether the study involves selection bias,
Q203: Provide an appropriate response.<br>-Suppose that you