Multiple Choice
Construct a pie chart representing the given data set.
-Intended major of high school students:
A) 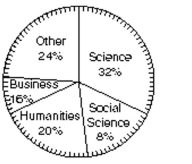
B) 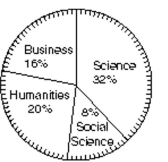
C) 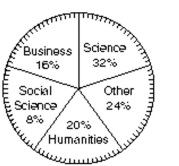
D) 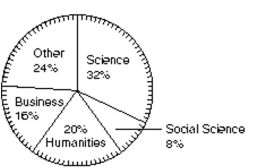
Correct Answer:

Verified
Correct Answer:
Verified
Related Questions
Q130: State whether you think that the variables
Q131: A sample statistic and margin of
Q132: A statement is made about correlation. State
Q133: Solve the problem.<br>-For the study described below,
Q134: The graph below shows the approximate annual
Q136: State whether you think that the variables
Q137: Answer as requested.<br>-A researcher finds a positive
Q138: Answer the question.<br>-Which type of graphs can
Q139: Use the guidelines to evaluate the study.
Q140: Provide an appropriate response.<br>-Shortly before an