Multiple Choice
Construct a pie chart representing the given data set.
- 
A) 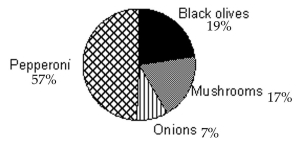
B) 
C) 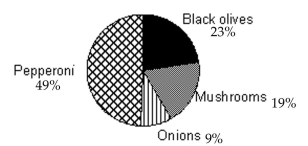
D) 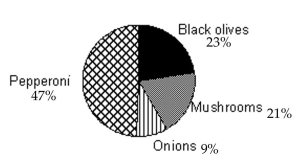
Correct Answer:

Verified
Correct Answer:
Verified
Related Questions
Q54: Construct a pie chart representing the
Q55: Provide an appropriate response.<br>-Suppose that you construct
Q56: Answer the question.<br>-Which of the following describes
Q57: Use the graph to answer the question.<br>-<img
Q58: Use the indicated bin size to
Q60: A sample statistic and margin of
Q61: <img src="https://d2lvgg3v3hfg70.cloudfront.net/TB3069/.jpg" alt=" Identify which of
Q62: Make a bar graph to represent
Q63: Identify which of these types of sampling
Q64: Identify the variable as either qualitative or