Multiple Choice
Use the graph to answer the question.
-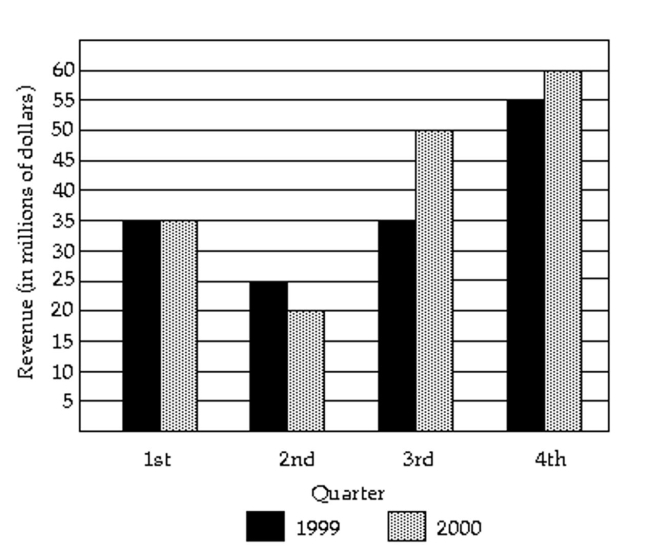 In what quarter was the revenue the greatest for 1999?
A) first quarter
B) second quarter
C) third quarter
D) fourth quarter
Correct Answer:

Verified
Correct Answer:
Verified
Related Questions
Q52: Make a scatter diagram for the
Q53: Use the graph to answer the question.<br>-<img
Q54: Construct a pie chart representing the
Q55: Provide an appropriate response.<br>-Suppose that you construct
Q56: Answer the question.<br>-Which of the following describes
Q58: Use the indicated bin size to
Q59: Construct a pie chart representing the
Q60: A sample statistic and margin of
Q61: <img src="https://d2lvgg3v3hfg70.cloudfront.net/TB3069/.jpg" alt=" Identify which of
Q62: Make a bar graph to represent