Multiple Choice
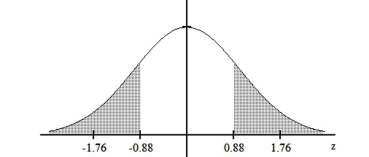
Use a table of areas to obtain the shaded area under the standard normal curve.
-
A)
B)
C)
D)
Correct Answer:

Verified
Correct Answer:
Verified
Related Questions
Q1: Solve the problem.<br>-Data were reported for
Q2: Use a table of areas for
Q3: Use a table of areas to
Q4: Scores on an aptitude test are normally
Q6: A normal probability plot is given below
Q7: Suppose that you know the area under
Q8: Frequency data were reported for the
Q9: Find the specified percentile, quartile, or decile.<br>-The
Q10: Find the specified percentile, quartile, or decile.<br>-A
Q11: Use a table of areas to