Multiple Choice
Solve the problem.
-Here are the summary statistics for mathematics scores for one high-school graduating class, and the parallel boxplots comparing the scores of male and female students. Write a brief report on These results. Be sure to discuss center and variation. 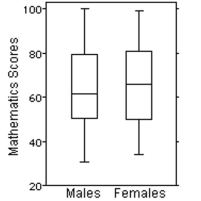
A) Median score by females at 66 points is 3 points higher than that by males. The middle 50% for both group is close with a IQR at 26 for the males and 30 for the females. The males have a Larger range from 30 to 100. The distribution is slightly right-skewed for the males and Symmetric for the females.
B) Median score by females at 66 points is 3 points higher than that by males. The middle 50% for both group is close with a IQR at 26 for the males and 30 for the females. The males have a Smaller range from 36 to 98. Both distributions are left-skewed.
C) Median score by females at 66 points is 3 points higher than that by males. The middle 50% for both group is close with a IQR at 26 for the males and 30 for the females. The males have a Larger range from 30 to 100. Both distributions are right-skewed.
D) Median score by females at 66 points is 3 points higher than that by males. The middle 50% for both group is close with a IQR at 30 for the males and 26 for the females. The males have a Smaller range from 36 to 98. The distribution is right-skewed for the males and symmetric for The females.
Correct Answer:

Verified
Correct Answer:
Verified
Q54: Explain how two data sets could have
Q145: Provide an appropriate response.<br>-Following is the
Q146: A census bureau collects information about the
Q147: The test scores of 40 students
Q148: Find the median for the given
Q149: A variable x has a mean, µ,
Q152: Use the empirical rule to solve
Q153: Find the population standard deviation. Round
Q154: Explain how to find the adjacent values
Q155: Construct and interpret a boxplot or