Multiple Choice
Construct and interpret a boxplot or a modified boxplot as specified.
-The weekly salaries (in dollars) of 24 randomly selected employees of a company are shown below. Construct a boxplot for the data.
A) 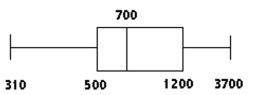
B) 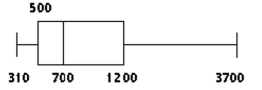
C) 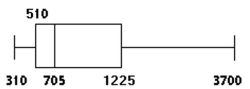
D) 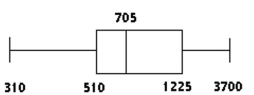
Correct Answer:

Verified
Correct Answer:
Verified
Related Questions
Q54: Explain how two data sets could have
Q150: Solve the problem.<br>-Here are the summary
Q152: Use the empirical rule to solve
Q153: Find the population standard deviation. Round
Q154: Explain how to find the adjacent values
Q156: Which boxplot shape (uniform, bell-shaped, or
Q157: Identify potential outliers, if any, for
Q158: Solve the problem. If necessary, round
Q159: Provide an appropriate response.<br>-Find the z-score corresponding
Q160: Find the median for the given